Visualizations
Comparing Police Presence with Students Inciting Incidents at Various High Schools

About Line Graphs: The upper visualization, Reported Police Presence at Charlestown High School, Hyde Park High School, and L Street Annex, January-May 1976, shows the police presence reported by CCC monitors over time at Charlestown High School, Hyde Park High School, and L Street Annex. The lower visualization, Students Inciting Incidents at Charlestown High School, Hyde Park High School, and L Street Annex, January-May 1976, shows the number of students inciting reported by CCC monitors over time at the same three high schools. Both visualizations use the same axes.
Analysis: During the spring semester of 1976, the number of police officers at each school usually outnumbered the number of students inciting incidents. Hyde Park High School, with a 15% Black student body before busing compared to 2% or less at the other two schools, was consistently assigned more police officers despite fewer incidents. The visualizations also show that officials responded to the January 26 protest by 121 white students at Charlestown High School by sending 150 police officers. This suggests that officials acknowledged the potential for violence by white students in one extraordinary instance but on a day-to-day basis, officials assigned more police officers to the more diverse Hyde Park High School despite a relative lack of risk.
Interact with Visualization: Hover your cursor over an individual data point in either visualization to see the number of police officers or students inciting incidents recorded by CCC monitors. Click on an individual data point in the upper visualization to see how many students inciting incidents were reported at that school on that date in the lower visualization. Click on an individual data point in the lower visualization to see how many police officers were reported at that school on that date in the upper visualization. Double click on the white space of that visualization to reset.
Comparing Police Presence with Students Inciting Incidents Overall
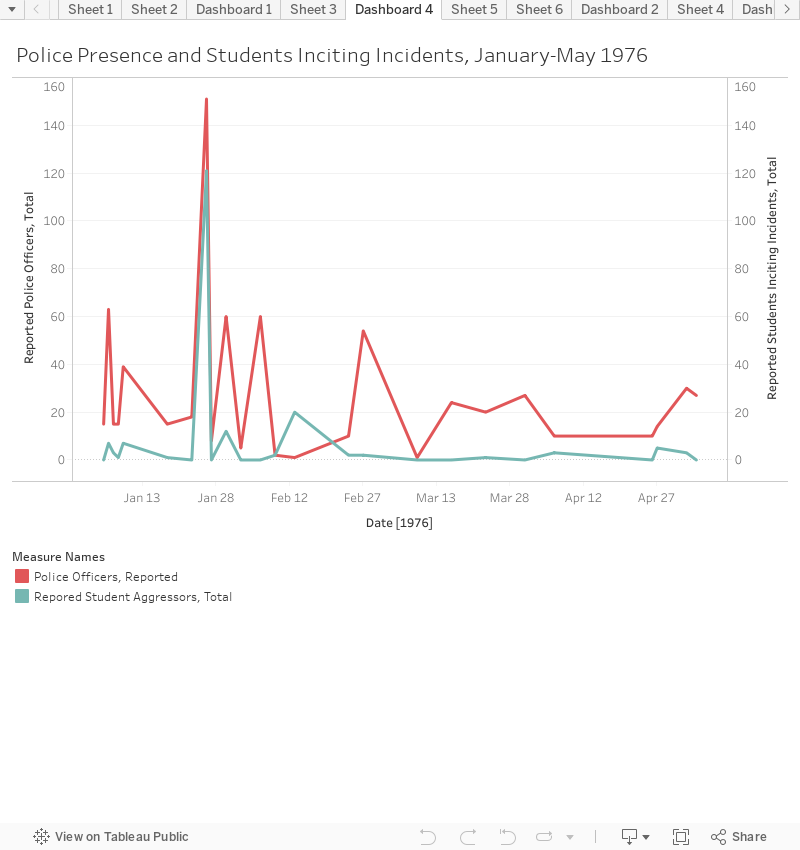
About Line Graph: This visualization, Police Presence and Students Inciting Incidents Overall, combines data for Charlestown High School, Hyde Park High School, and L Street Annex to display the total number of police officers versus total number of reported students inciting incidents from January to May 1976.
Analysis: During Spring 1976, the total number of police officers at these three schools always exceeded the number of students inciting incidents except for February 9 and February 13. The spike on January 26 reflects an organized protest by 121 white students at Charlestown High School. There was a greater number of student incidents at the beginning of the semester and a large but inconsistent police presence. From March until May, the number of students inciting incidents decreased significantly but there remained a relatively high police presence. This suggests that officials and administrators may have viewed police presence as a preemptive measure against student misbehavior.
Interact with Visualization: Hover your cursor over a data point to see how many police officers or students inciting incidents were reported in total on a single day. Pick a date and click on one of the lines to highlight its data set, then hover your cursor over the same date on the other line to compare. Double click on the white space of the visualization to reset.
Comparing Police Presence, White Students Inciting Incidents, and Black Students Inciting Incidents
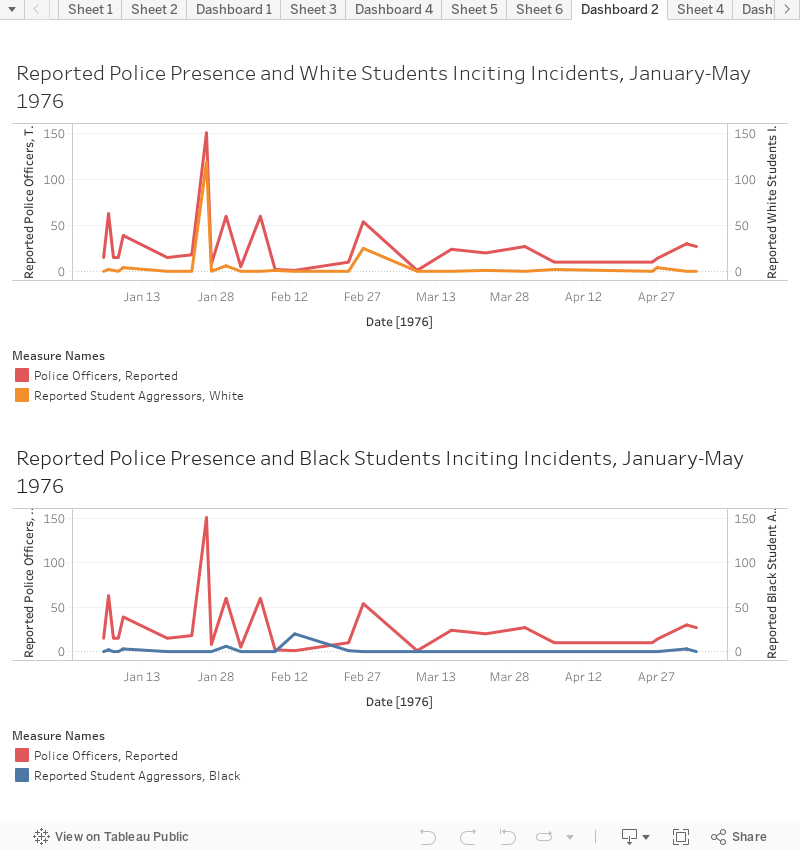
About Line Graphs: The next pair of visualizations, Comparing Police Presence, White Students Inciting Incidents, and Black Students Inciting Incidents, contain the same data set for reported total police officers. The upper visualization, Reported Police Presence and White Students Inciting Incidents, January-May 1976, compares this with the total number of white students initiating incidents. The lower visualization, Reported Police Presence and Black Students Inciting Incidents, January-May 1976, compares police officers with the number of Black students initiating incidents.
Analysis: These visualizations show that white students were more likely to incite incidents than Black students. Additionally, the number of police officers is more closely correlated with the number of white students, suggesting that school administrators and law enforcement often anticipated upticks in white student misbehavior. Considering the first set of visualizations, Comparing Police Presence with Students Inciting Incidents at Various High Schools, this data does not necessarily suggest that white students were unfairly disciplined and policed more than Black students. Because the first set of visualizations suggests that the more diverse Hyde Park High School was low risk and highly policed, the data in these visualizations suggest that white students were indeed more like to incite violent or verbal incidents.
Interact with Visualization: Hover your cursor over an individual data point in either visualization to see the number of police officers, white students inciting incidents, or Black students inciting incidents recorded by CCC monitors. Click on an individual data point in the upper visualization to see how many police officers or Black students inciting incidents were reported on that date in the lower visualization. Click on an individual data point in the lower visualization to see how many police officers or white students inciting incidents were reported on that date in the upper visualization. Double click on the white space of that visualization to reset.
Types of Punishments

About Bar Graph: In the Punishments for Students Inciting Incidents, January-May 1976 visualization, there are vertical bars showing the total number of students receiving one of five categories of punishments at all three high schools during Spring 1976. The five categories include arrest, none, being sent home, suspension, and unknown.
Analysis: The visualization illustrates that suspension was the most common type of disciplinary action by a significant margin. The next most common categories of punishment were none or unidentified in the monitor reports. Fewer than six students were sent home or arrested at these high schools during this period. This raises the question of what school administrators and law enforcement believed the role of police officers was. Either administrators were reluctant to have students prosecuted by the criminal justice system or officials agreed that the risk of serious criminal activity was low and that police officers were present to enforce discipline within the school itself. The CCC monitor reports do not make clear why it was decided that police officers, often armed, should enforce school discipline.
Interact with Visualization: Hover your cursor over any of the bars to see how many students received a particular type of punishment. Click on any bar to highlight that category. Double click on the white space of the visualization to reset.