Monitor Report Timeline: Methodology
Methodology
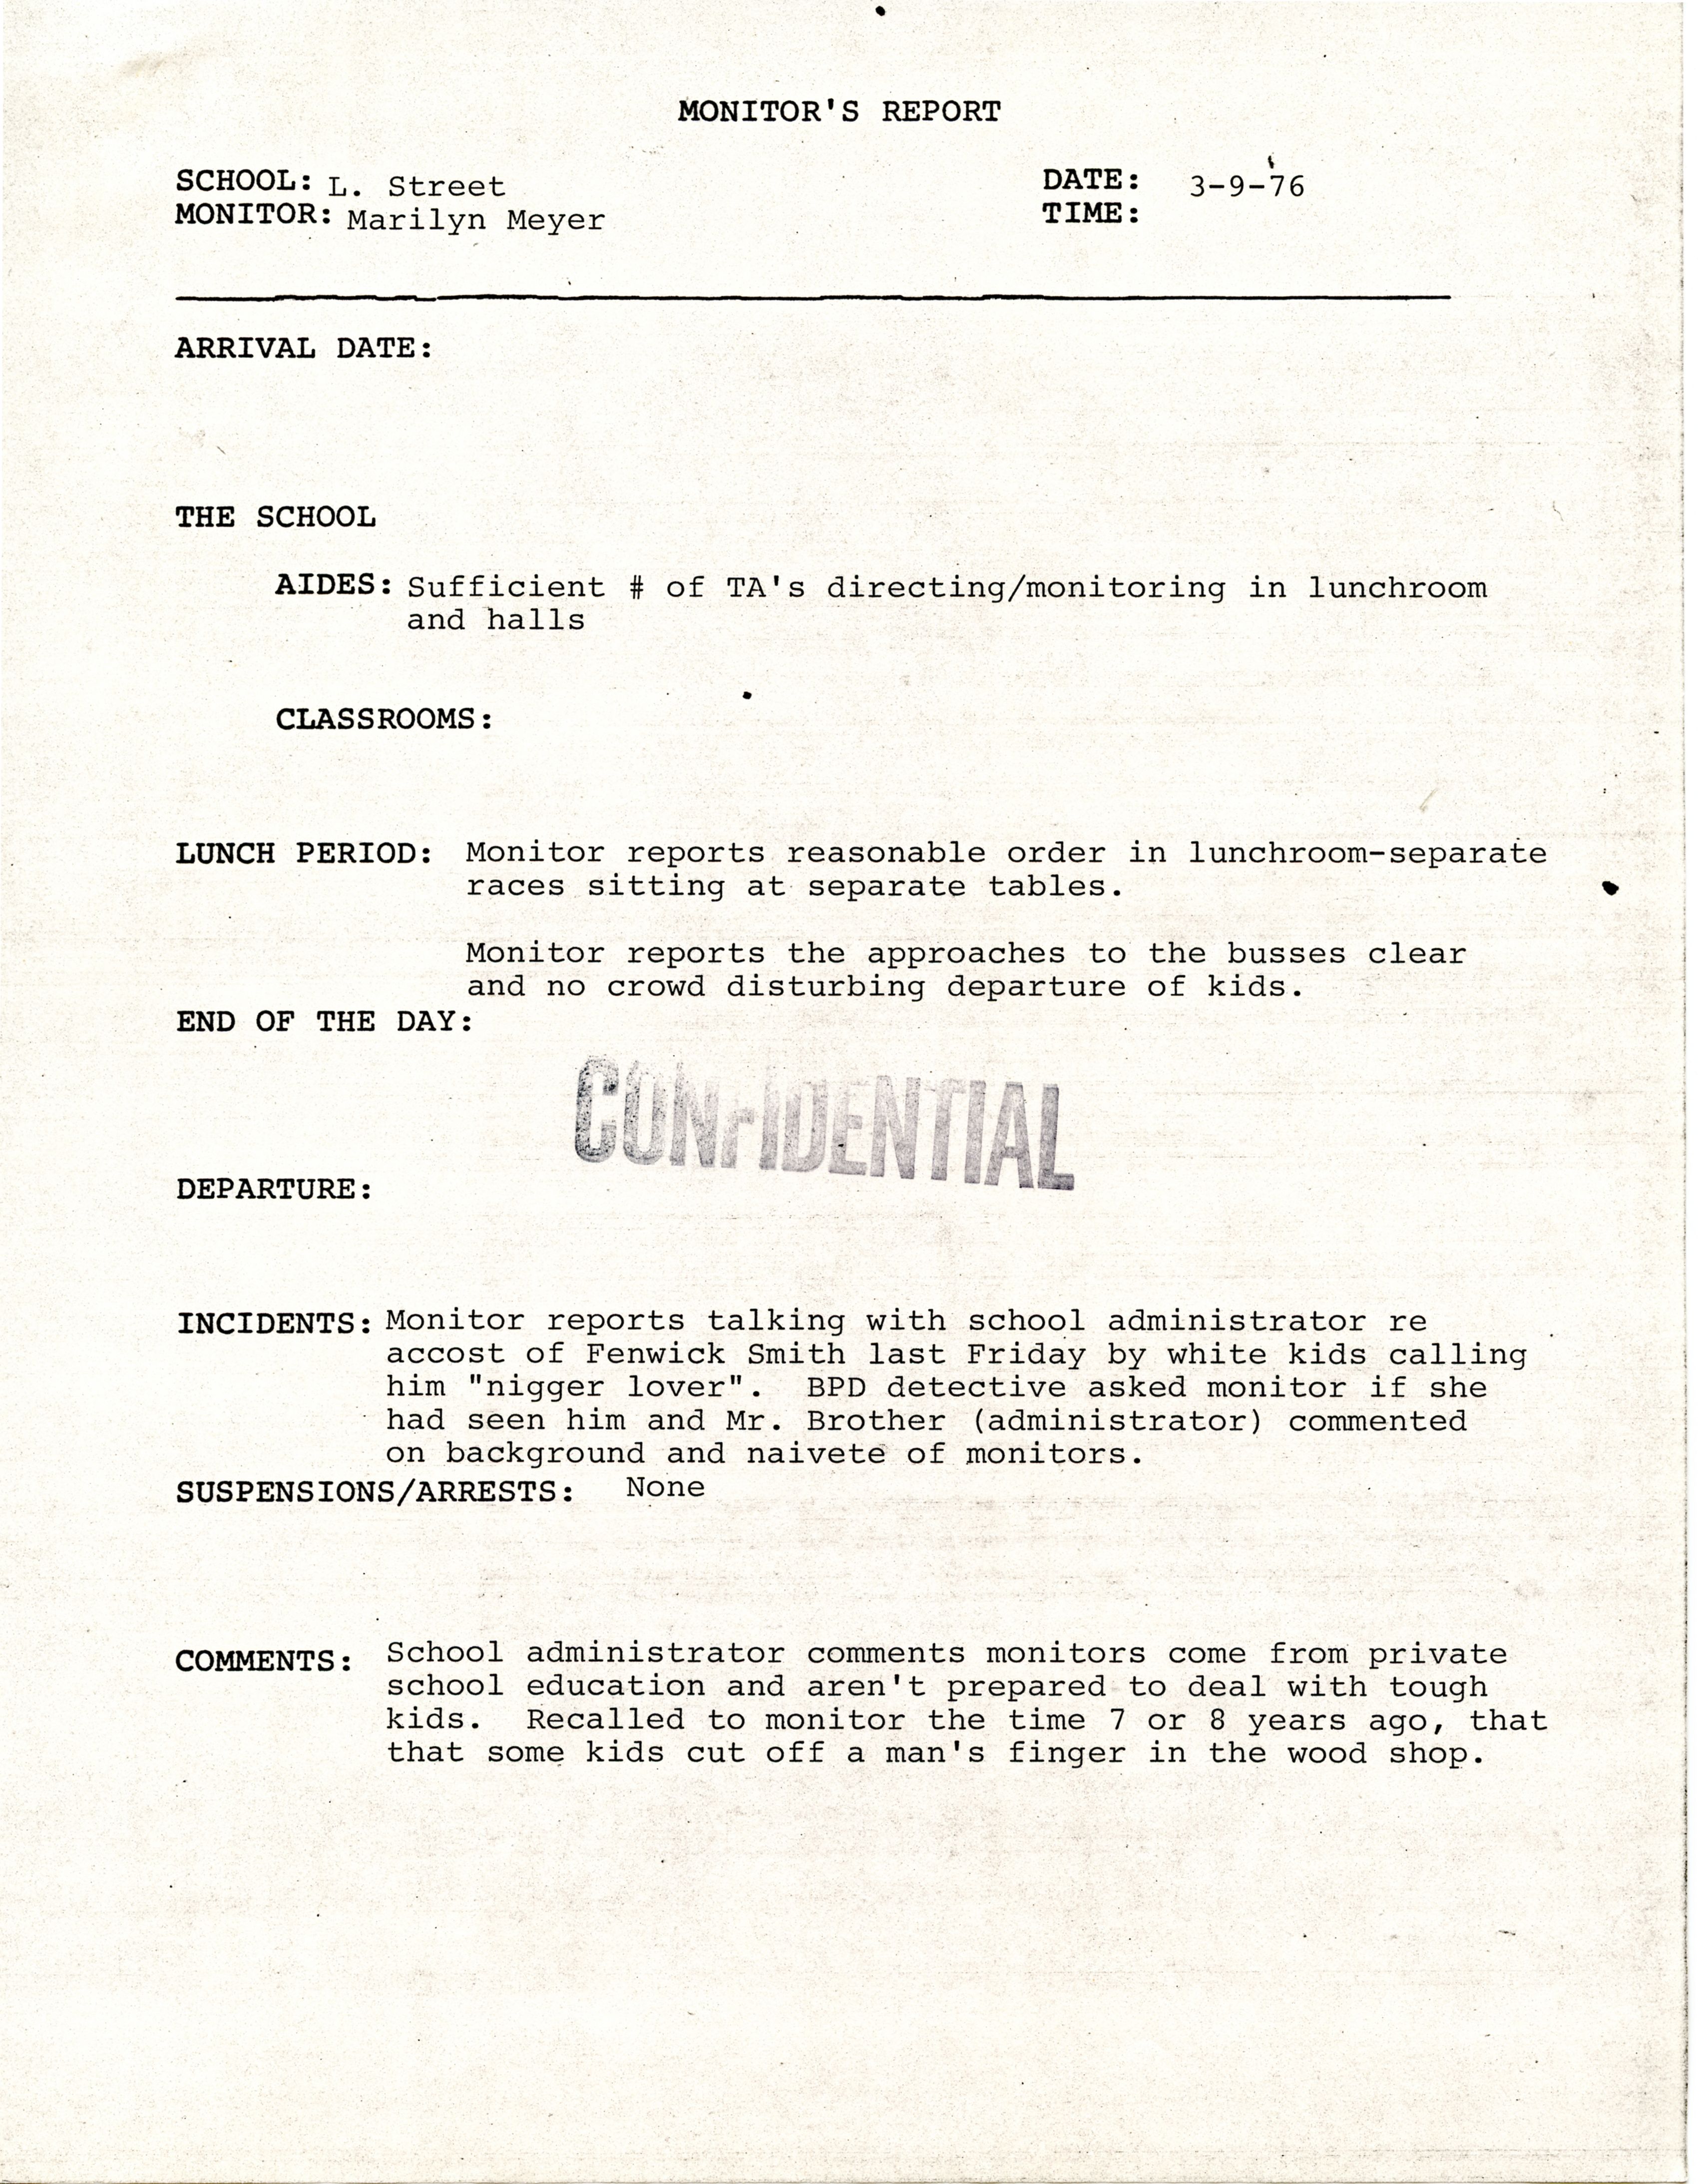
The timeline was created using monitor reports drawn from BC’s digital archive. Thus, the information available is limited to dates within the 1976 calendar year. While there are additional reports available, due to the current COVID-19 situation, ongoing construction at the John J. Burns Library, and the short time period available to produce this project, it was decided to limit the source material to the digitized documents. This limited pool was further narrowed down by selecting two schools, Hyde Park High School, and L Street Annex—a branch school connected to South Boston High School. These schools where chosen for several reasons: Geographically, the two are distant enough to represent distinct and separate neighborhoods with their own demographic mixes. Numerically, they were also two of the schools whose records were of an amount which fit neatly within the limited scope and timeline of this project—Timeline JS’s recommended number of slides is roughly twenty, anymore and the timeline becomes cluttered and difficult to navigate. In the case of Hyde Park High School, all the monitor reports are represented though some take a condensed or merged form due to lack of content. The L Street Annex records required more curation to trim their number down to a manageable size. This was done by omitting the lower content reports and keeping those which carried certain “narrative” threads—such as the recurring presence of a certain student, or those leading up to and immediately after certain incidents, or those coinciding with city wide incidents. After this curation, the data sets are unique enough to be seen as representing two different data groups, and small enough to be fit within the limitation of Timeline JS and the scope of this project.
Once the data pool was chosen, the reports were sorted by school and converted into a spread sheet format which recorded dates, monitor names, individual incidents, the number of people involved, the race and gender of those involved, the times of the incidents, the number of police present at the school, and any other actions taken during the day of the report. This information was then further refined and reformatted to be compliant with the Timeline JS spreadsheet template and its guidelines. Doing so involved choosing which data would be expressed through the timeline and how. The date and locations information were preserved for organizational purposes, allowing for the timeline to be split into two parallel groups, one for Hyde Park and one for L Street Annex. Other portions of the data were integrated into the text of the individual entries themselves—these included the monitor, notable incidents or comments made by the monitor, and other less quantifiable aspects of their reports. For the purposes of this timeline, information regarding the amount of the police present, and the brief comments on certain moments throughout the day—arrival, lunch, end of day, etc.—where removed or only included when deemed necessary to the larger narrative which developed over the development of the timeline.
As the data was entered into Timeline JS, two specific periods were identified, one for each school, which contained incidents that went above and beyond the more isolated verbal confrontations and physical altercations which dominate the monitor reports. These were then marked using Timeline JS’s “era” encoding, allowing them to be represented on the final timeline in colored tabs beneath the timeline itself. To unearth the impact of these periods a further timeline section was created to house several contemporary media accounts of these incidents. After further analysis, a decision was made to attempt to fill in the lengthy void in the Hyde Park High School reports, from February 6th until May 5th, through media reports. During this process a third period was identified that, unlike the previous two, was not limited to a singular school but which affected both and the entire school system itself. Thus another “era” was added to highlight this period as well.
Organizing and laying out the data in a visual timeline allows for a better and easier understanding of the sequence of events and their relation to one another. It allows us to piece together and note trends across the schools, as well as identifying incidents which spread beyond the confines of individual locations and spilled into the larger school system. This in turn allows for new questions and theories to be raised about the era, such as how administrators handled things differently, what role did the teachers or monitors play in some of these situations, what tactics each school employed, and which worked, and which didn’t. It further allows for speculation on cross community interaction and reaction to the events in question, thus opening new avenues of study and exploration for larger and lengthier projects not hampered by the constraints face at the current time—such as the access restriction placed on many archives, being limited to digitized documents, the small window of time available to engage in the research and creation of this project, etc.
A copy of the original spread sheet is available for viewing and download here.