
Mapping Literature with ArcGIS
Genre of text: novels
Course level: beginner
Student difficulty: low to moderate
Teacher Preparation: low
Semester time: anytime
Estimated time: ~1 hour prior to each class, 55 minutes in class
Learning Objectives:
- Students will learn about GIS tools including ArcGIS and Map Warper.
- Students will begin to develop basic mapping techniques.
- Students will learn about techniques to promote deeper understanding of a text.
Teachers note: This data in this two-part lesson is drawn from Wilkie Collins’ novel Armadale, originally published as a serial between 1864-1866. Neither the students nor the professor need to be familiar with the novel for the lesson to be effective! The goal is to familiarize the students with ArcGIS and to walk them through what mapping the locations of a novel looks like.
Lesson Documents:
- Wilkie Collins' Armadale: A Novel (New York: Harper, 1874) on Internet Archive.
- Google Slide Deck for Lesson (link) --> Recommend copying and modifying to teacher's preferences
- Google Sheet with list of locations from Armadale for lesson (link) for student use --> copy for each new class.
Prep:
This lesson is designed to use Armadale as a dataset. Teachers are encouraged, however, to use a novel or other text from their own class in place of Collin's novel.
Using Collin's Armadale:
- If the teacher does not already have an ArcGIS account, the teacher should go to the ArcGIS Public Account login screen (click here) and sign up. The public account is free but does not allow as many options as an institutional account.
- The teacher should go through all of the steps that they will demonstrate in the two classes in order to ensure flow during classtime.
Using a different text:
- Pick a novel relevant to the course.
- Using a Google Sheet, Excel, or other spreadsheet application, create a list of the places the novel tracks.
- Include a column for "Org" (to keep track of organization).
- Include a column for "Place" (to keep track of location).
- Save the sheet with an appropriate name. Consider [Course#-Author-Blank]
- Duplicate the sheet.
- Save the new sheet with an appropriate name. Consider [Course#-Author-LatLong]
- Add one column for latitude and one column for longitude.
- Add in the latitude and longitude in DD format for each location.
- Save your work.
- Upload your locations into ArcGIS (or Google's My Maps) and verify accuracy.
Lesson 1:
Time: 55 min
- Intro: Today, we are going to be talking about mapping movement in literature. The goal is for you to become familiar with the program ArcGIS so that you can do your own online mapping. This data we are using is drawn from Wilkie Collins’ novel Armadale, originally published as a serial between 1864-1866.
- Briefly introduce Armadale: The London-born novelist and playwright Wilkie Collins (1824-1889) became well known in Britain for his sensation novels. Armadale is one of Collins’ four major novels. It is the story of a generational curse inherited with the name “Allan Armadale.” We’re using this book as an example today because of how focused it is on place, and because of the large geographic spread.
- Open ArcGIS. For this part, have students watch you do this on the projector first rather than following along on their own laptops.
- Briefly introduce ArcGIS public. This is a mapping software that allows you to build interactive web maps. There is a desktop version called ArcGIS Pro that allows you to do even more, but we will be using the online version available through BC which is still very powerful and allows us to do a whole range of things.
- Go to the “Map” tab
- Show students the default map, how to navigate (zoom in and out, move side to side).
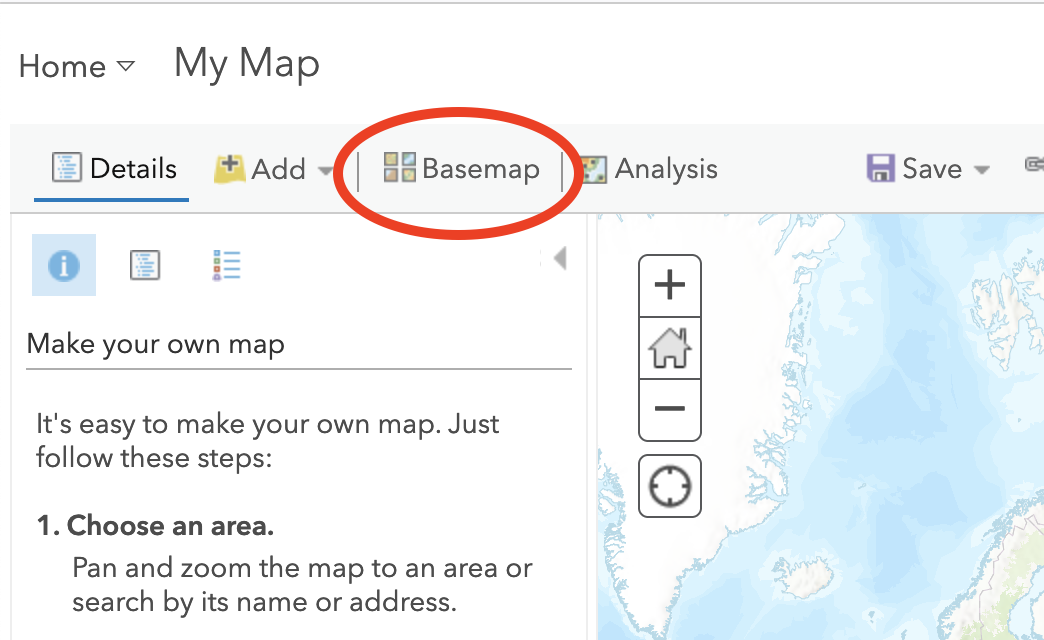
- Show students how to change the basemap by clicking on the “basemap” tab (fig. 1)
- Explain that the next step is to bring in the location points that we want so that we can make a map of the locations in the book. This happens by creating an excel spreadsheet with the data, then converting it into a CSV (comma separated value) file and importing it into ArcGIS. This is what we will do together now.
Latitude is measured off of the equator, and longitude is measured off of the Prime Meridian in Greenwich, England. For locations that are south of the equator (like Australia), place a negative sign before the latitude coordinate. For locations that are west of the Prime Meridian (like Boston), place a negative sign before the longitude coordinate.
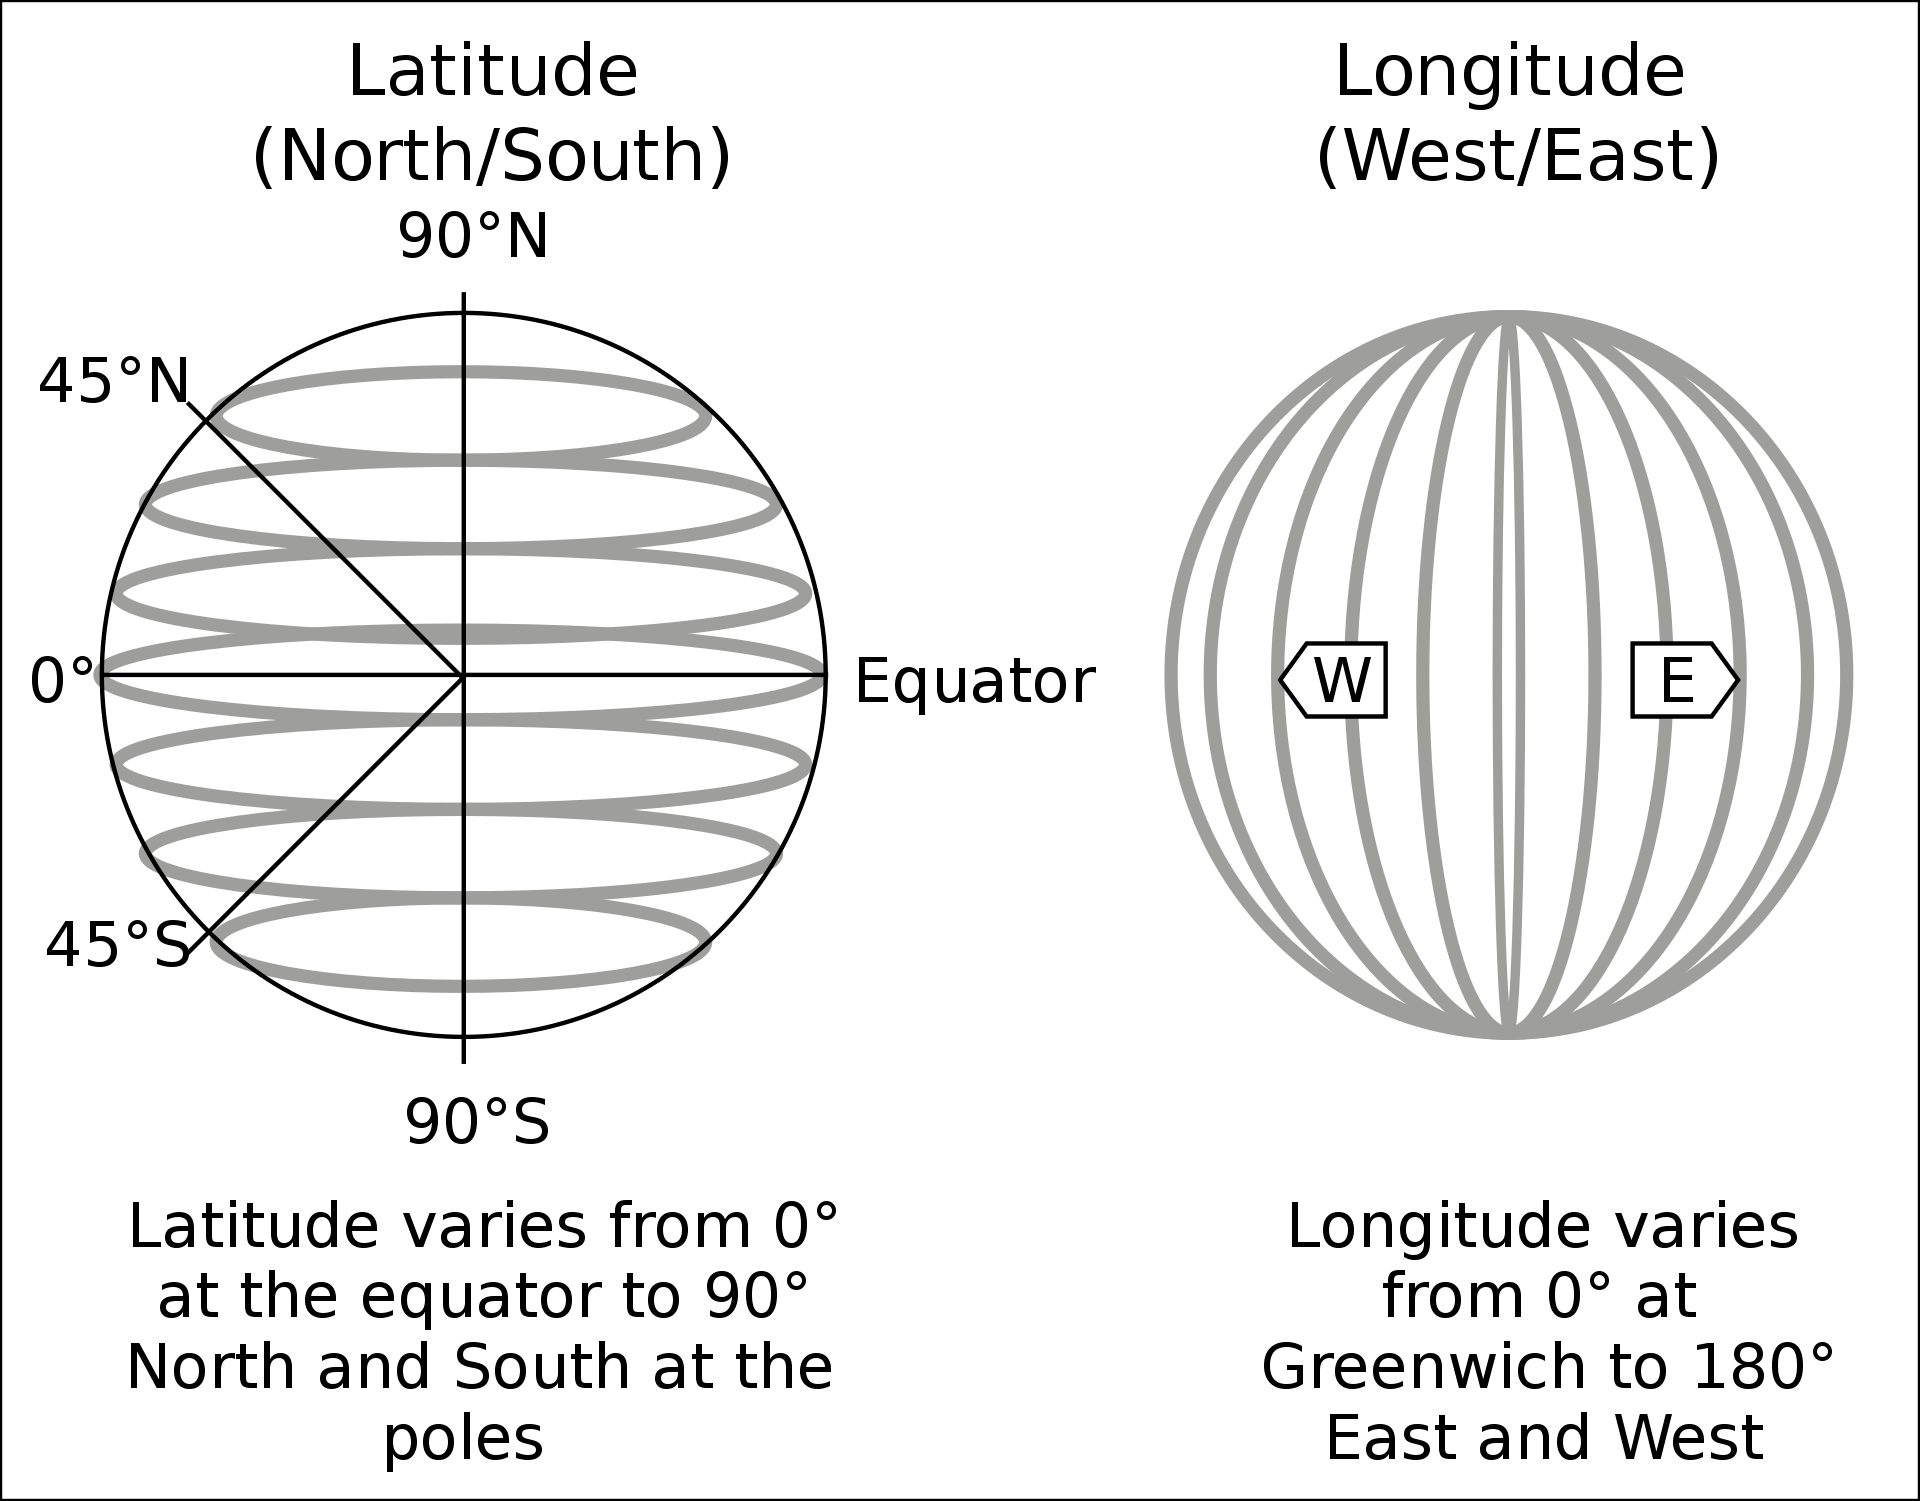
- Tell students that it's important that they use the decimal degrees (DD) system. Example: for London, that would be latitude 51.509865 (note the positive) and longitude -0.118092 (note the minus sign).
- Split students into groups, have them find the longitude and latitude of a couple of the points on the shared google excel document. Have them enter the longitude and latitude in the appropriate cells. Some of the data points are more specific than others. For example, “Castletown, Isle of Man” or “Pimlico, London” are both much more specific than “Switzerland” or “mainland Scotland.” Do your best! When you do this type of project for a book of your own choosing, you will have more context clues to help you make this type of decision. Justifying the decisions you make is part of the process of mapping literature.
- Model for the students: If you want to deal with this by visually selecting a spot on the map, you can go on Google Maps (maps.google.com), find the location that you would like, and right click on it. The coordinates will come up. Click the coordinates to copy them, then put them into the excel document. This strategy works particularly well for a location like “Somersetshire, England, an unnamed fishing village on the shores of the Bristol Channel.
Note that there is a column that says “page number”- students don’t need to fill this out, this is just a placeholder to remind them that when they do their own project, they need to keep track of where their data is coming from.
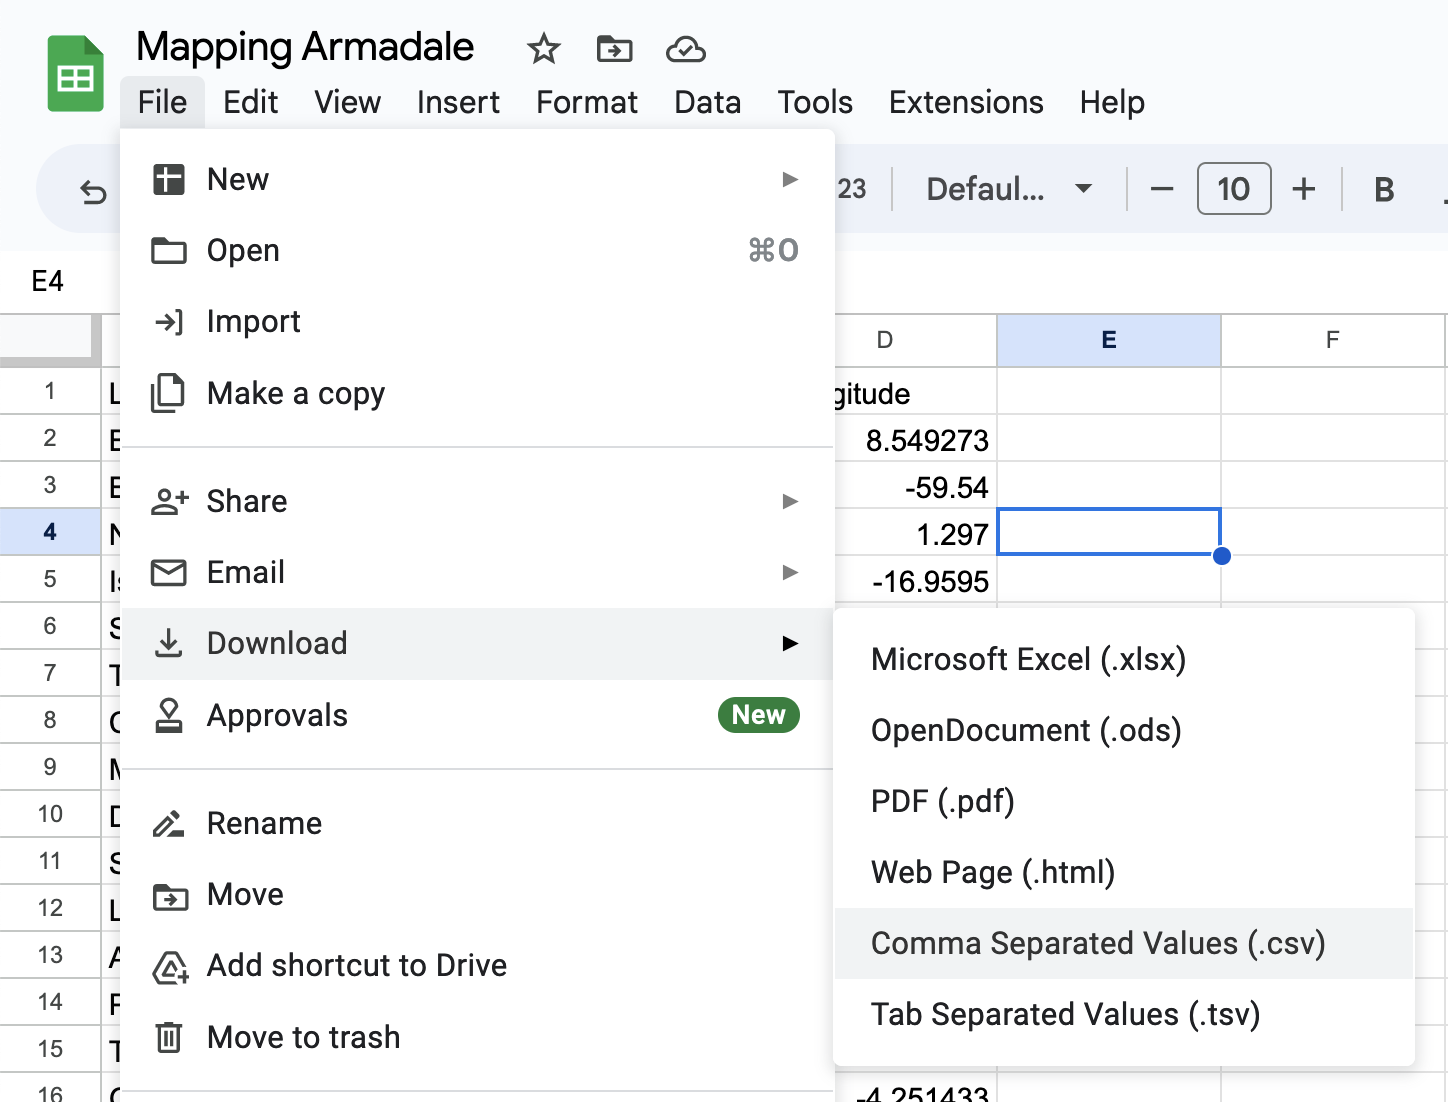
Note also that the column titles are as simplified as possible, and the titles with more than one word are connected by an underscore. This is so that the document can be converted into a CSV file. - Reconvene. Look at the completed spreadsheet together. Now, you will convert the Excel spreadsheet to a CSV form so that you can import it to ArcGIS. In Google excel, do the following commands
- Go to “File” → “Download” → “Comma Separated Values (.csv)” (see fig. 2: Converting spreadsheet to CSV)
- Now, you will demonstrate inputting the data from the spreadsheet into ArcGIS.
Go to your ArcGIS and complete the following commands:- Go to “Add” → “Add layer from file” → “browse” → select your file —> “import layer” (see figures 4 and 5)
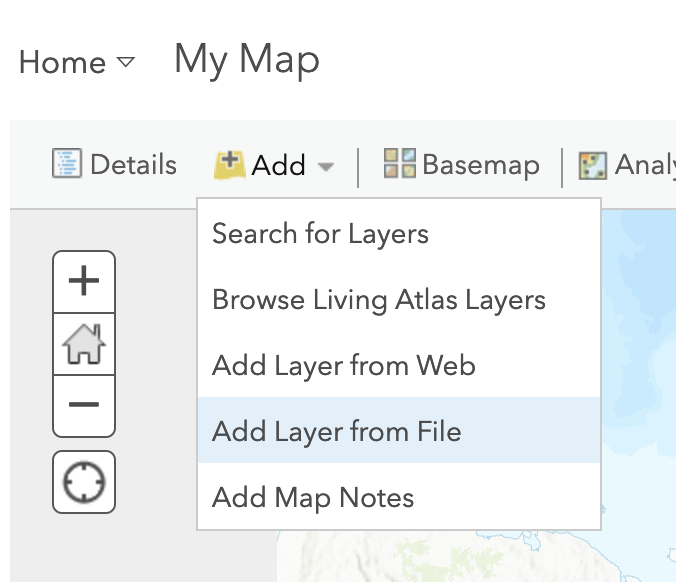
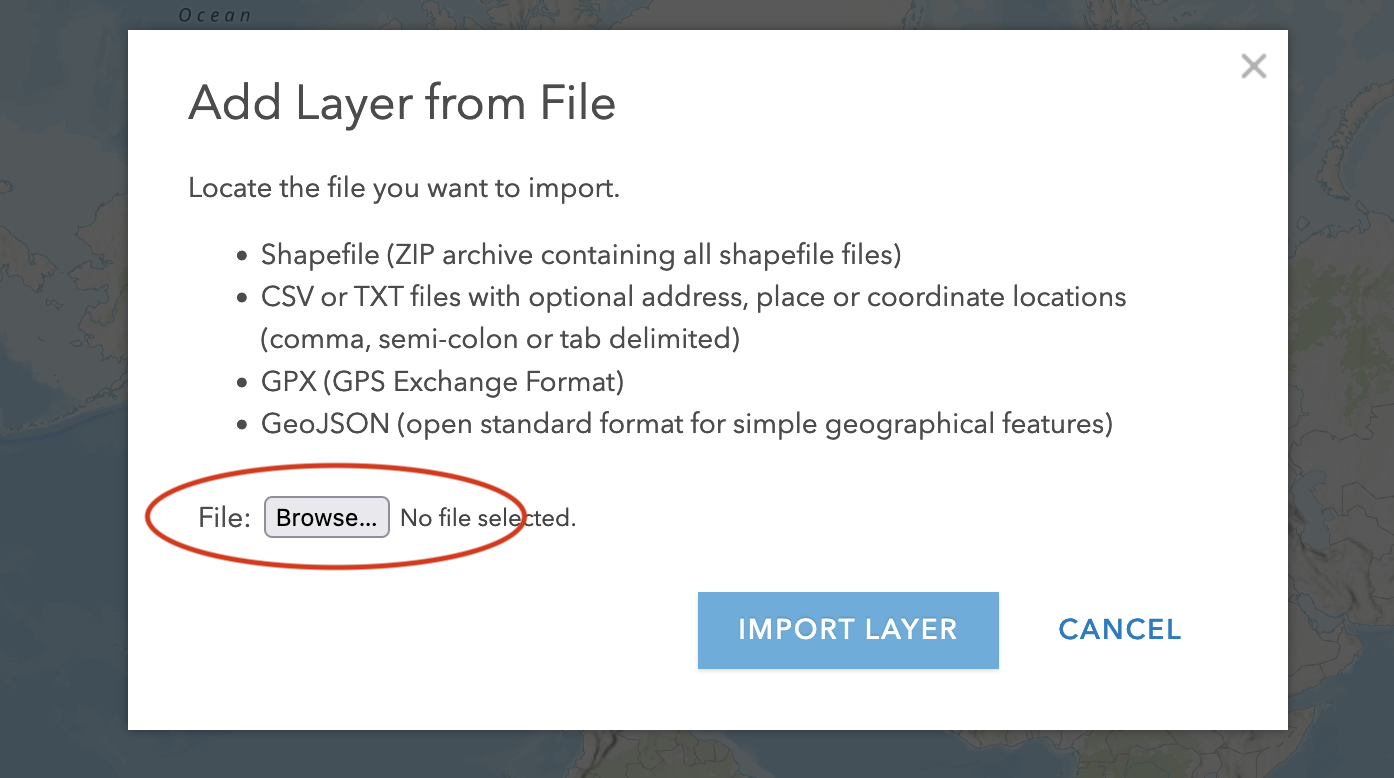
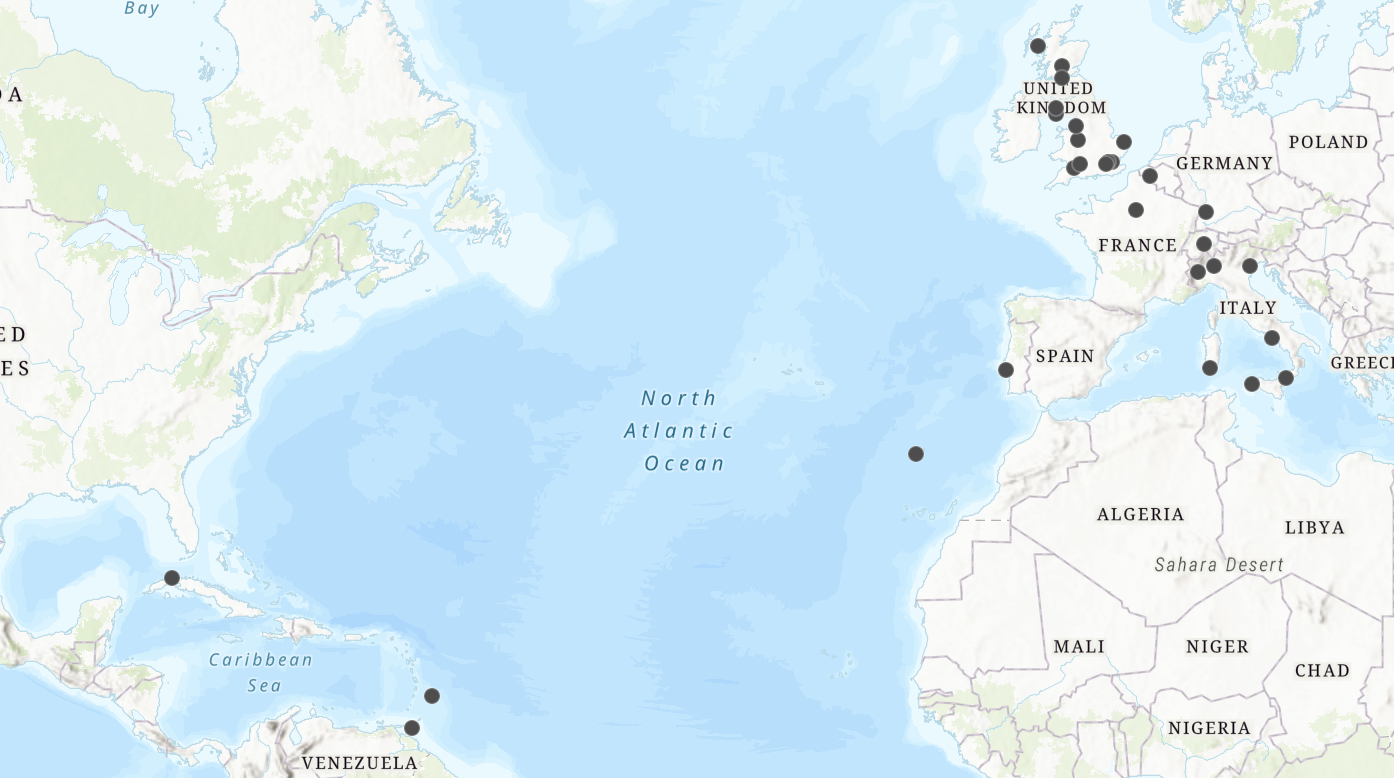
- The data points should now appear on the map!
- Explain to students that, if/when they add more columns of analysis, they can use this to visually sort the data points in the map.
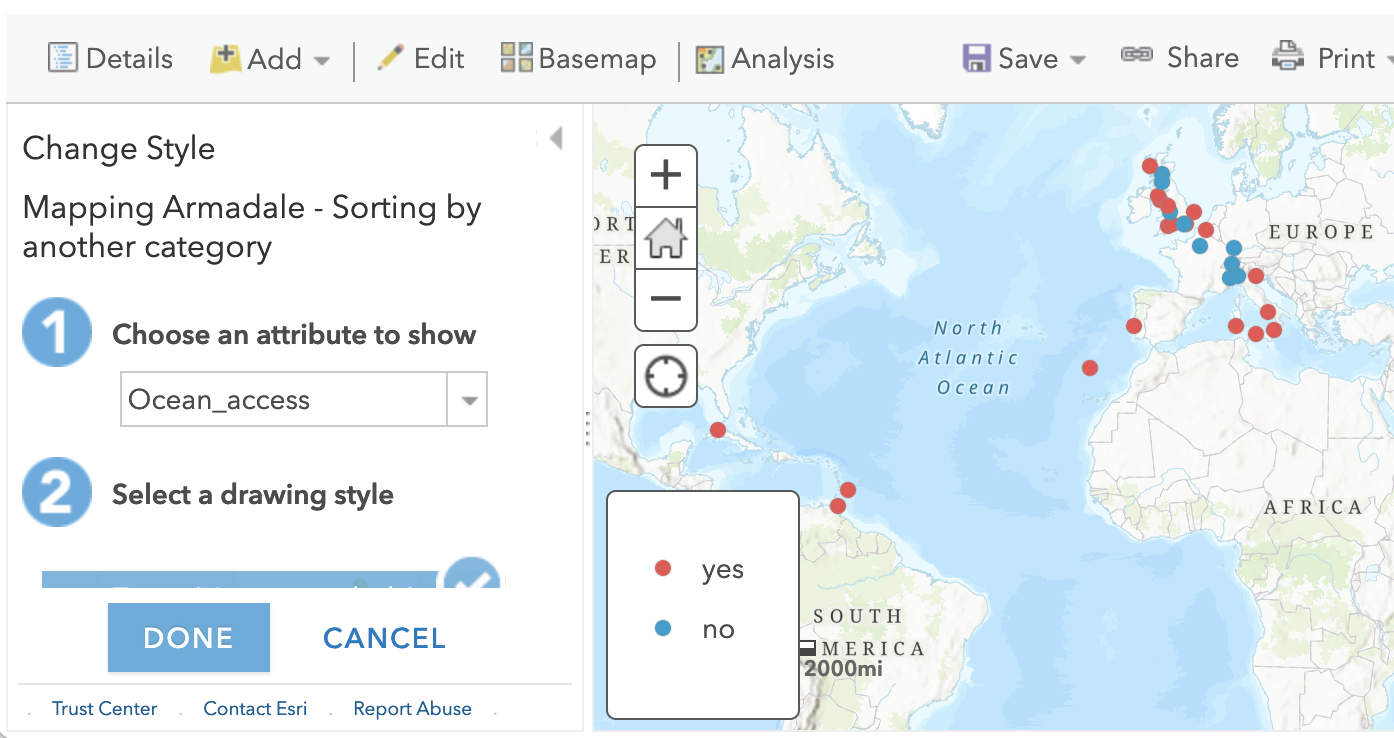
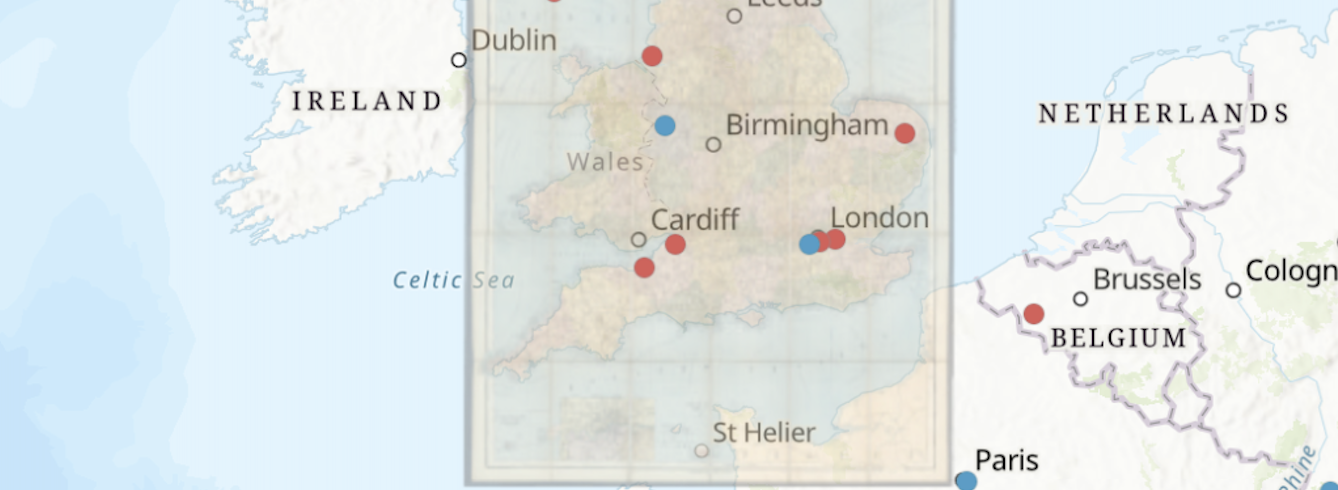
- Tell the students: In the above image, we just imported the excel document with the additional column “Ocean_access''.
- Model: You can choose the attribute you want to show. The map is now sorting the points based on whether or not they are directly accessible by the ocean. What we end up seeing is that the vast majority of points are in fact accessible. You can change the colors of these points, change the labeling, and more. Encourage students to play around with this. You can also create labels for each of the points.
Student activity:
- In the remaining time: Have students set up an ArcGIS account (at least 5 min). Then, have the students spend the rest of the class testing out ArcGIS on their own.
- Remind the students to save their maps as they go!!