
Working with the 19th c. U.S. Census
--Emily Dupuis, last updated in May 2023.
Collecting census data provides exciting possibilities for creating a broad overview of the daily lives of people who may otherwise be absent in historiographical sources. Deciding which information to collect to create your dataset, however, can be difficult.
To have the smoothest possible experience, one should follow a few steps.
- Choose Your Topic
- Find the Relevant Census
- Select Your Data
- Organize and Clean Your Data
- Recommended: Create Visualizations to Aid Interpretation
1. Choose Your Topic

"Kate Miley," 1880, photograph, Joseph P. Healey Library. | With courtesy from UMass Boston.
For this sample project, I want to create data visualizations reflecting the lived experiences of immigrants in late 19th century Boston. I can start with collections of photographs and other materials in places like the Digital Commonwealth. Immigrant experiences can, however, be hard to track as many people had limited literacy and kept few records. Even when they did, only a handful of repositories were interested in storing that information.
Drawing on census information from 1880 (as a sample of the 19th century), I can glean information regarding the daily lives of immigrants regarding occupations and personal relationships. I can also find information on community via the neighborhoods in which they resided. The data will be confined to those born not in the United States, ensuring the focus is on first-generation immigrants.
With that information, my research can them illustrate the lives of individuals and communities otherwise unrecorded in traditional historiographical sources. In doing so, we--scholars--can recapture that which was important to immigrant communities and illuminate their importance in the history of Boston.
Tip: I broke my topic (lived experiences of immigrants in late 19th century Boston) into a when (19th century); where (Boston, Massachusetts); who (immigrants); and (what). Those keywords will help both with finding scholarly material - but also in deciding what kind of primary sources I need.
2. Find the Relevant Census Years and Portions
There are several places to go to find the U.S. census, depending on what you're looking for. I recommend checking out your Library's research guide on the topic (example of BCL's research guide for the U.S. census).
Depending on what your looking for and what services your institution subscribes to, services like the following can be immeasurably useful:
- Historical Statistics of the United States
- IPUMS Integrated Public Use Microdata
- Social Explorer
For the 19th century, however, none of these have the granular levels of information collected in each census. One might--and I did--have to go to digital copies through services like Ancestry.com. I recommend contacting your institution's librarian if you are having trouble locating what you need (contact information is often on the relevant Research Guide).
3. Select Your Data
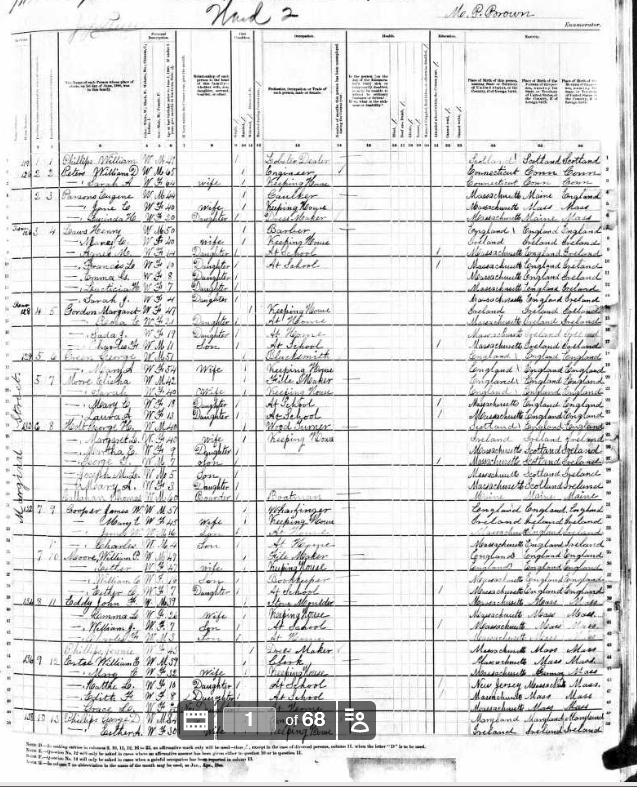
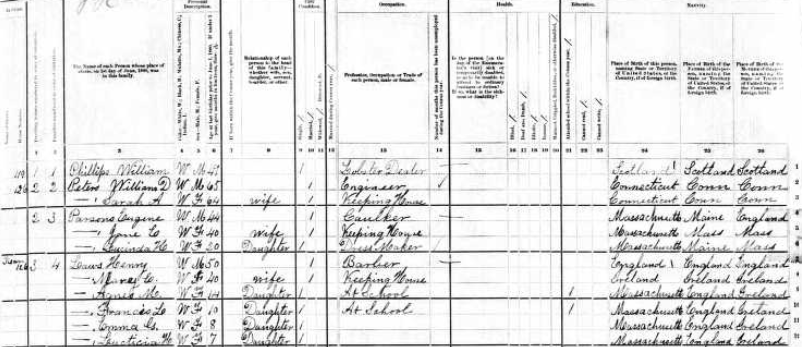
For this project, I started by looking at what the census even had. I wanted information on lived experience and--for my years--I found employment, place of birth, age, and literacy as well as address and relationship to head of household.
By using these categories, it's possible to discover patterns in the data. For instance, by looking at address and surname, I could infer that family members often moved to the same neighborhood--if not the exact same house--once they arrived in Boston.
Such patterns speak to the possible insecurity of immigrant life, and reflect how people sought to create new community structures in an unfamiliar environment. We don’t necessarily have letters and diaries detailing the emotional lives of those recorded in the census; yet by examining the data we can extract information about their experiences as immigrants, as well as the ways in which they sought to ease homesickness and assert control over the Boston landscape.
Tip: If you're working with data from print, think about how you might want to add to it as you go. First, however, check to see if someone has already created a digital copy.
4. Organize and Clean Your Data
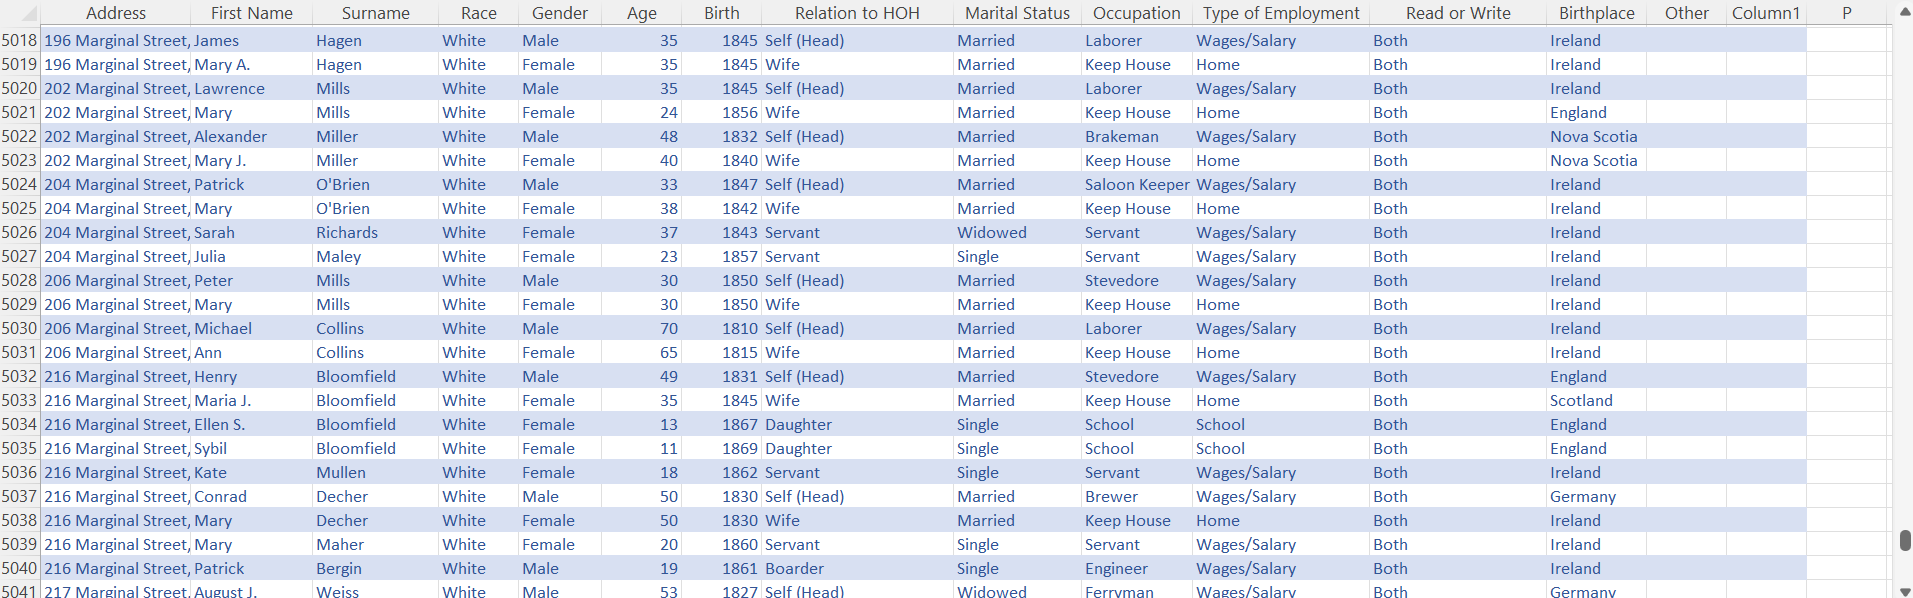
To find these patterns, structuring data is essential. To do so, I began transcribing (a long, careful proess) the census data from the scanned pages to a Google Spreadsheet. As I did so, it quickly became clear that categories like "occupation" had too many different types of answers to easily analyze. Furthermore, I realized that covering all of Boston was simply too much. Instead of trying to cover the whole city, I opted to focus on Ward 1.
To address this issue, I added categories to help organize. For instance, I added the categories of “wages/salary” or “home” to signify whether an individual worked for money or provided unpaid labor in the domestic sphere. Such simplicity is useful in conjunction with the more specific category of their exact employment, since census takers recorded occupations in various ways and thus have made it difficult to neatly categorize jobs. By adding simpler categories of my own, I have been able to keep the incredibly varied data of the census itself while making it easier to understand for both myself and external viewers.
Tip: Adding extra categories for organization make developing charts and other visualizations later.
It's important as you go to save frequently and create back ups of your data. This process is original, scholarly interpretive work and extremely valuable. Depending on how far you go, you may want to deposit your finished sheet in your local data repository.
5. Create Visualizations to Aid Interpretation
Once my data was assembled and cleaned, I then took my data and created a series of visualizations to help me interpret it. Depending on how far I want to go, there are different tools for creating simple--or highly complex--visualizations. You can take a look at some suggestions for tool types in the Collaborative Digital Project Lab's suggestion list. I want to explore several options and chose to get a (free as of 2023) educational license for Tableau.
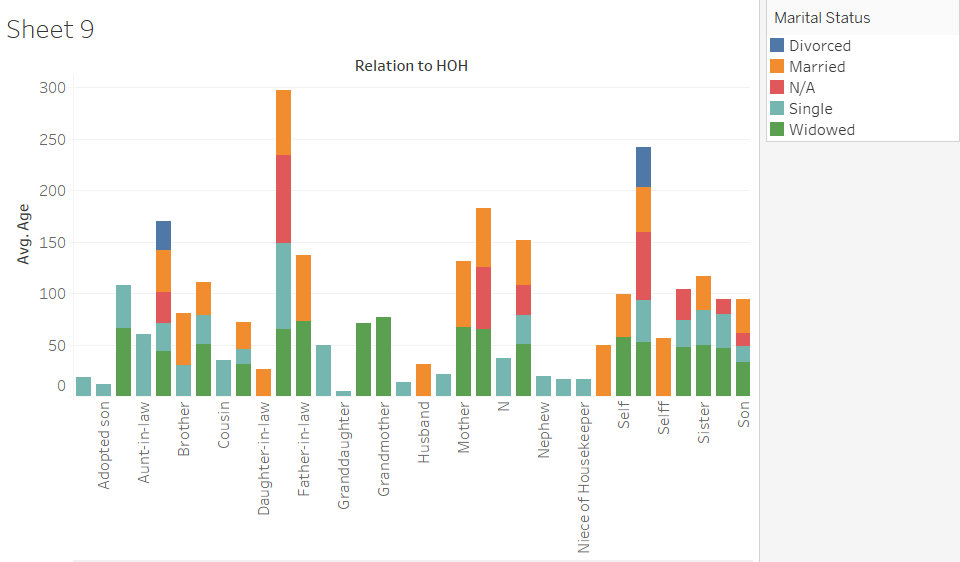
Sample 1
Relating age, marital status, and relationship to head of household (HOH), this graph shows the myriad relationships which defined community structures among immigrants in Boston. Note how the colors highlights the different marital status for each nephew, husban, and more.
Tip: Extra categories for organization make developing charts and other visualizations later.
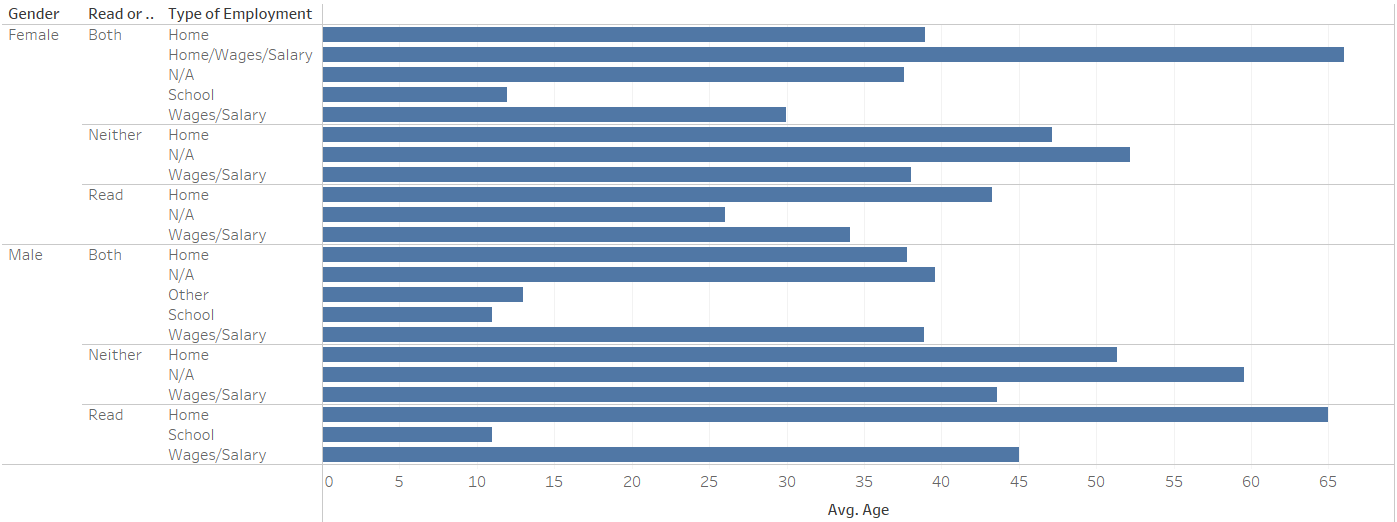
Sample 2
This graph shows the connections between literacy (being able to read, write, both, or neither), gender, and occupation. Age is also a factor. As can be seen, people who could only read or had no literacy at all tended to work in paid jobs until a later age, reflecting differences in class and education access.
Tip: Extra categories for organization make developing charts and other visualizations later.
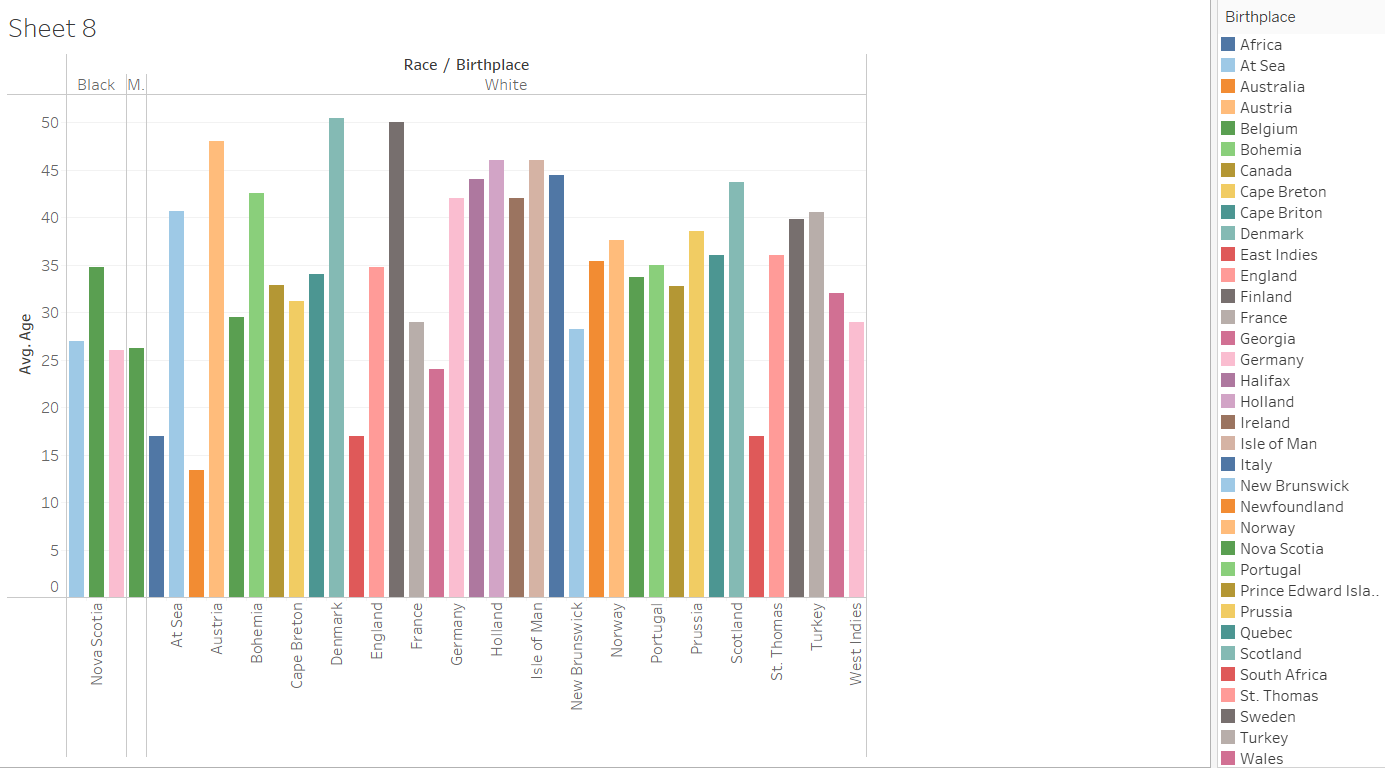
Sample 3
Comparing average age with country of birth and racial categorization, we can see the ethnic diversity of the immigrant community and get a sense of the age group (mostly between 20 and 50 years old) which comprised its population.
Tip: Extra categories for organization make developing charts and other visualizations later.
This particular project seeks to create data visualizations reflecting the lived experiences of immigrants in late 19th century Boston, providing just one example of how such data can be used to both obtain a broad perspective of daily life and provide opportunities for honing in on specific individuals and experiences.
Drawing on census information from 1880, this project provides information regarding the daily lives of immigrants, including their occupations, personal relationships, and information on the neighborhoods in which they resided. Ultimately, this work illustrates the lives of individuals and communities unrecorded in traditional history sources, recapturing recapture that which was important to them and illuminating their importance in the history of Boston.